Breaking News
Popular News


Enter your email address below and subscribe to our newsletter
We hold your privacy highly, this is the only reason we will use your email address. Cancel anytime.
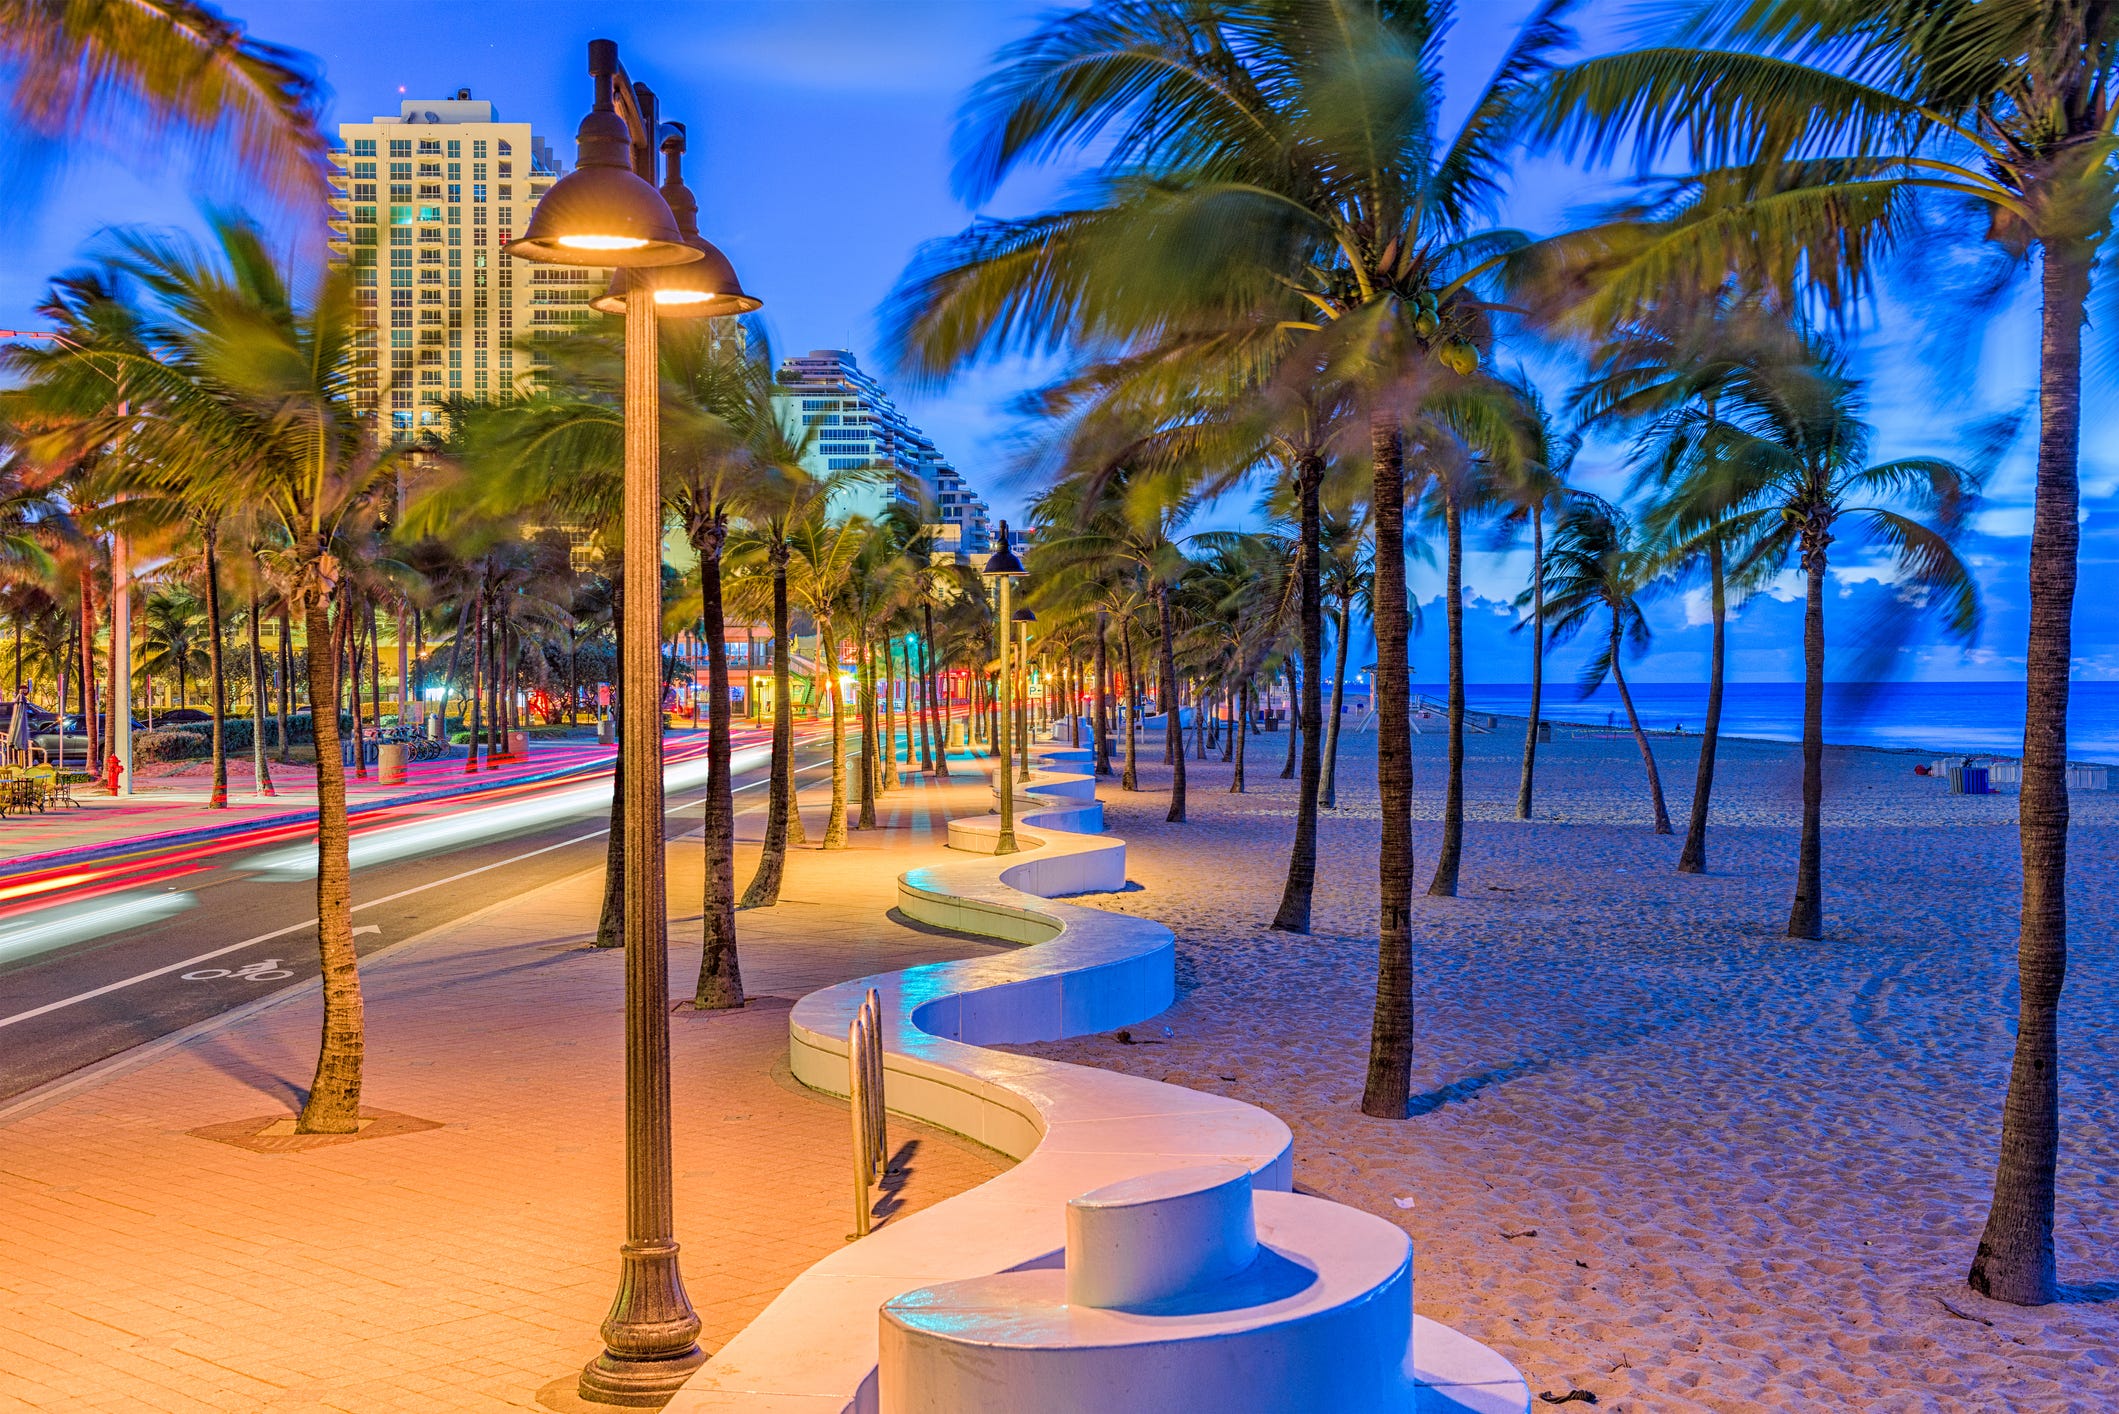
Fort Lauderdale, Florida –
| Confirmed cases: Miami-Dade Broward counties | Confirmed as of 10/04 total | Increase from 10/03 |
|---|---|---|
| Miami-Dade County *(deaths: 3,334/+4 since 10/03) | **172,205 | +329 |
| Broward County *(deaths: 1,420/+6 since 10/03) | **77,934 | +172 |
| * Number of tests recorded to date 10/04 | Total tests | Negative |
| Miami-Dade County | 933,264 (4.6% previous day positive- 18.48% overall positive) | 759,052 |
| Broward County | 578,703 (3.74% previous day positive- 13.47% overall positive) | 499,884 |
| City by City | Confirmed as of 10/04 | Increase from 10/03 |
| Miami, Dade | 97,688 | +159 |
| Hialeah, Dade | 23,874 | +26 |
| Fort Lauderdale, Broward | 16,738 | +24 |
| Hollywood, Broward | 14,473 | +24 |
| Homestead, Dade | 11,143 | +19 |
| Pompano Beach, Broward | 8,827 | +5 |
| Miramar, Broward | 4,988 | +12 |
| Miami Gardens, Dade | 4,739 | +10 |
| Miami Beach, Dade | 3,481 | +17 |
| Coral Springs, Broward | 3,441 | +9 |
| Sunrise, Broward | 2,887 | +4 |
| Davie, Broward | 2,872 | +8 |
| Miami Lakes, Dade | 2,797 | +13 |
| Coral Gables, Dade | 2,746 | +8 |
| Cutler Ridge, Dade | 2,405 | +12 |
| Plantation, Broward | 2,210 | +6 |
| North Miami Beach, Dade | 2,200 | +8 |
| Deerfield Beach, Broward | 2,180 | +3 |
| Opa Locka, Dade* | 2,156 | -3 |
| Tamarac, Broward | 2,146 | +18 |
| Doral, Dade | 2,000 | +0 |
| Weston, Broward | 1,865 | +5 |
| Margate, Broward | 1,721 | +5 |
| Coconut Creek, Broward | 1,541 | +1 |
| Hallandale, Broward | 1,496 | +4 |
| North Lauderdale, Broward | 1,489 | +2 |
| North Miami, Dade | 1,365 | +3 |
| Oakland Park, Broward | 1,160 | +4 |
| Carol City, Dade | 1,131 | +3 |
| Pembroke Pines, Broward | 1,059 | +0 |
| Coconut Grove, Dade | 1,027 | +13 |
| Biscayne Park, Dade | 904 | +3 |
| Florida City, Dade | 826 | -1 |
| Everglades National Park, Dade | 817 | +2 |
| Aventura, Dade | 715 | +0 |
| El Portal, Dade | 714 | +6 |
| Cooper City, Broward | 632 | +3 |
| Coral, Dade | 579 | +2 |
| Olympia Heights, Dade | 577 | +0 |
| Uleta, Dade | 572 | +2 |
| Key Biscayne, Dade | 546 | +1 |
| Dania, Broward | 545 | +1 |
| Parkland, Broward | 528 | +1 |
| Lauderdale Lakes, Broward | 416 | +1 |
| South Miami, Dade | 409 | +0 |
| Pinecrest, Dade | 388 | +4 |
| Lauderhill, Broward | 372 | +1 |
| Sweetwater, Dade | 340 | +0 |
| Wilton Manors, Broward | 312 | +1 |
| Fisher Island, Dade | 307 | +5 |
| Palmetto Bay, Dade | 229 | +1 |
| Southwest Ranches, Broward* | 221 | -1 |
| Medley, Dade* | 135 | -3 |
| Bay Harbour Islands, Dade | 133 | +2 |
| West Miami, Dade* | 64 | -1 |
| Surfside, Dade | 61 | +0 |
| Bal Harbour, Dade | 50 | +0 |
| Cutler Bay, Dade* | 44 | -2 |
| Lauderdale by-the-Sea, Broward | 43 | +0 |
| Princeton, Dade | 35 | +0 |
| Sunny Isles Beach, Dade | 32 | +1 |
| Kendall, Dade | 30 | +0 |
| Golden Beach, Dade | 30 | +0 |
| South Miami Heights, Dade | 25 | +0 |
| Naranja, Dade | 26 | +0 |
| Miami Springs, Dade | 20 | +0 |
| Hialeah Gardens, Dade | 19 | +0 |
| Lighthouse Point, Broward | 19 | +0 |
| Miami Shores, Dade | 17 | +0 |
| North Bay Village, Dade | 17 | +0 |
| West Park, Broward | 16 | +0 |
| Goulds, Dade | 12 | +0 |
| Perrine, Dade | 8 | +0 |
| Pembroke Park, Broward | 4 | +0 |
| Quail Heights, Dade | 4 | +0 |
| Leisure City, Dade | 4 | +0 |
| Indian Creek Village, Dade | 4 | +0 |
| Virginia Gardens, Dade | 3 | +0 |
| Hillsboro Beach, Broward | 2 | +0 |
| Port Everglades, Broward | 1 | +0 |
** Total cases overview of county includes positive cases in Florida residents and non-Florida residents tested in Florida *** Data in this report is provisional and subject to change ****City is not always received as part of initial notification and may be missing while case is being investigated.
Check more statistics at Florida’s COVID-19 Data and Surveillance Dashboard.